What is Ai Insights?
Ai Insights from Q5 Networks is an Ai driven analysis tool to help you quickly assess your voice communication performance.
It provides sentiment ratings for your selected phone conversations presented in an accessible visual format.
How does it work?
Each call configured for Ai Insights is transcribed sentence by sentence using Automatic Speech Recognition and Natural Language Selection then analyzed for positive, negative, or neutral sentiment of that sentence.
A rating is then calculated in order to assign a positive or negative overall value to the call.
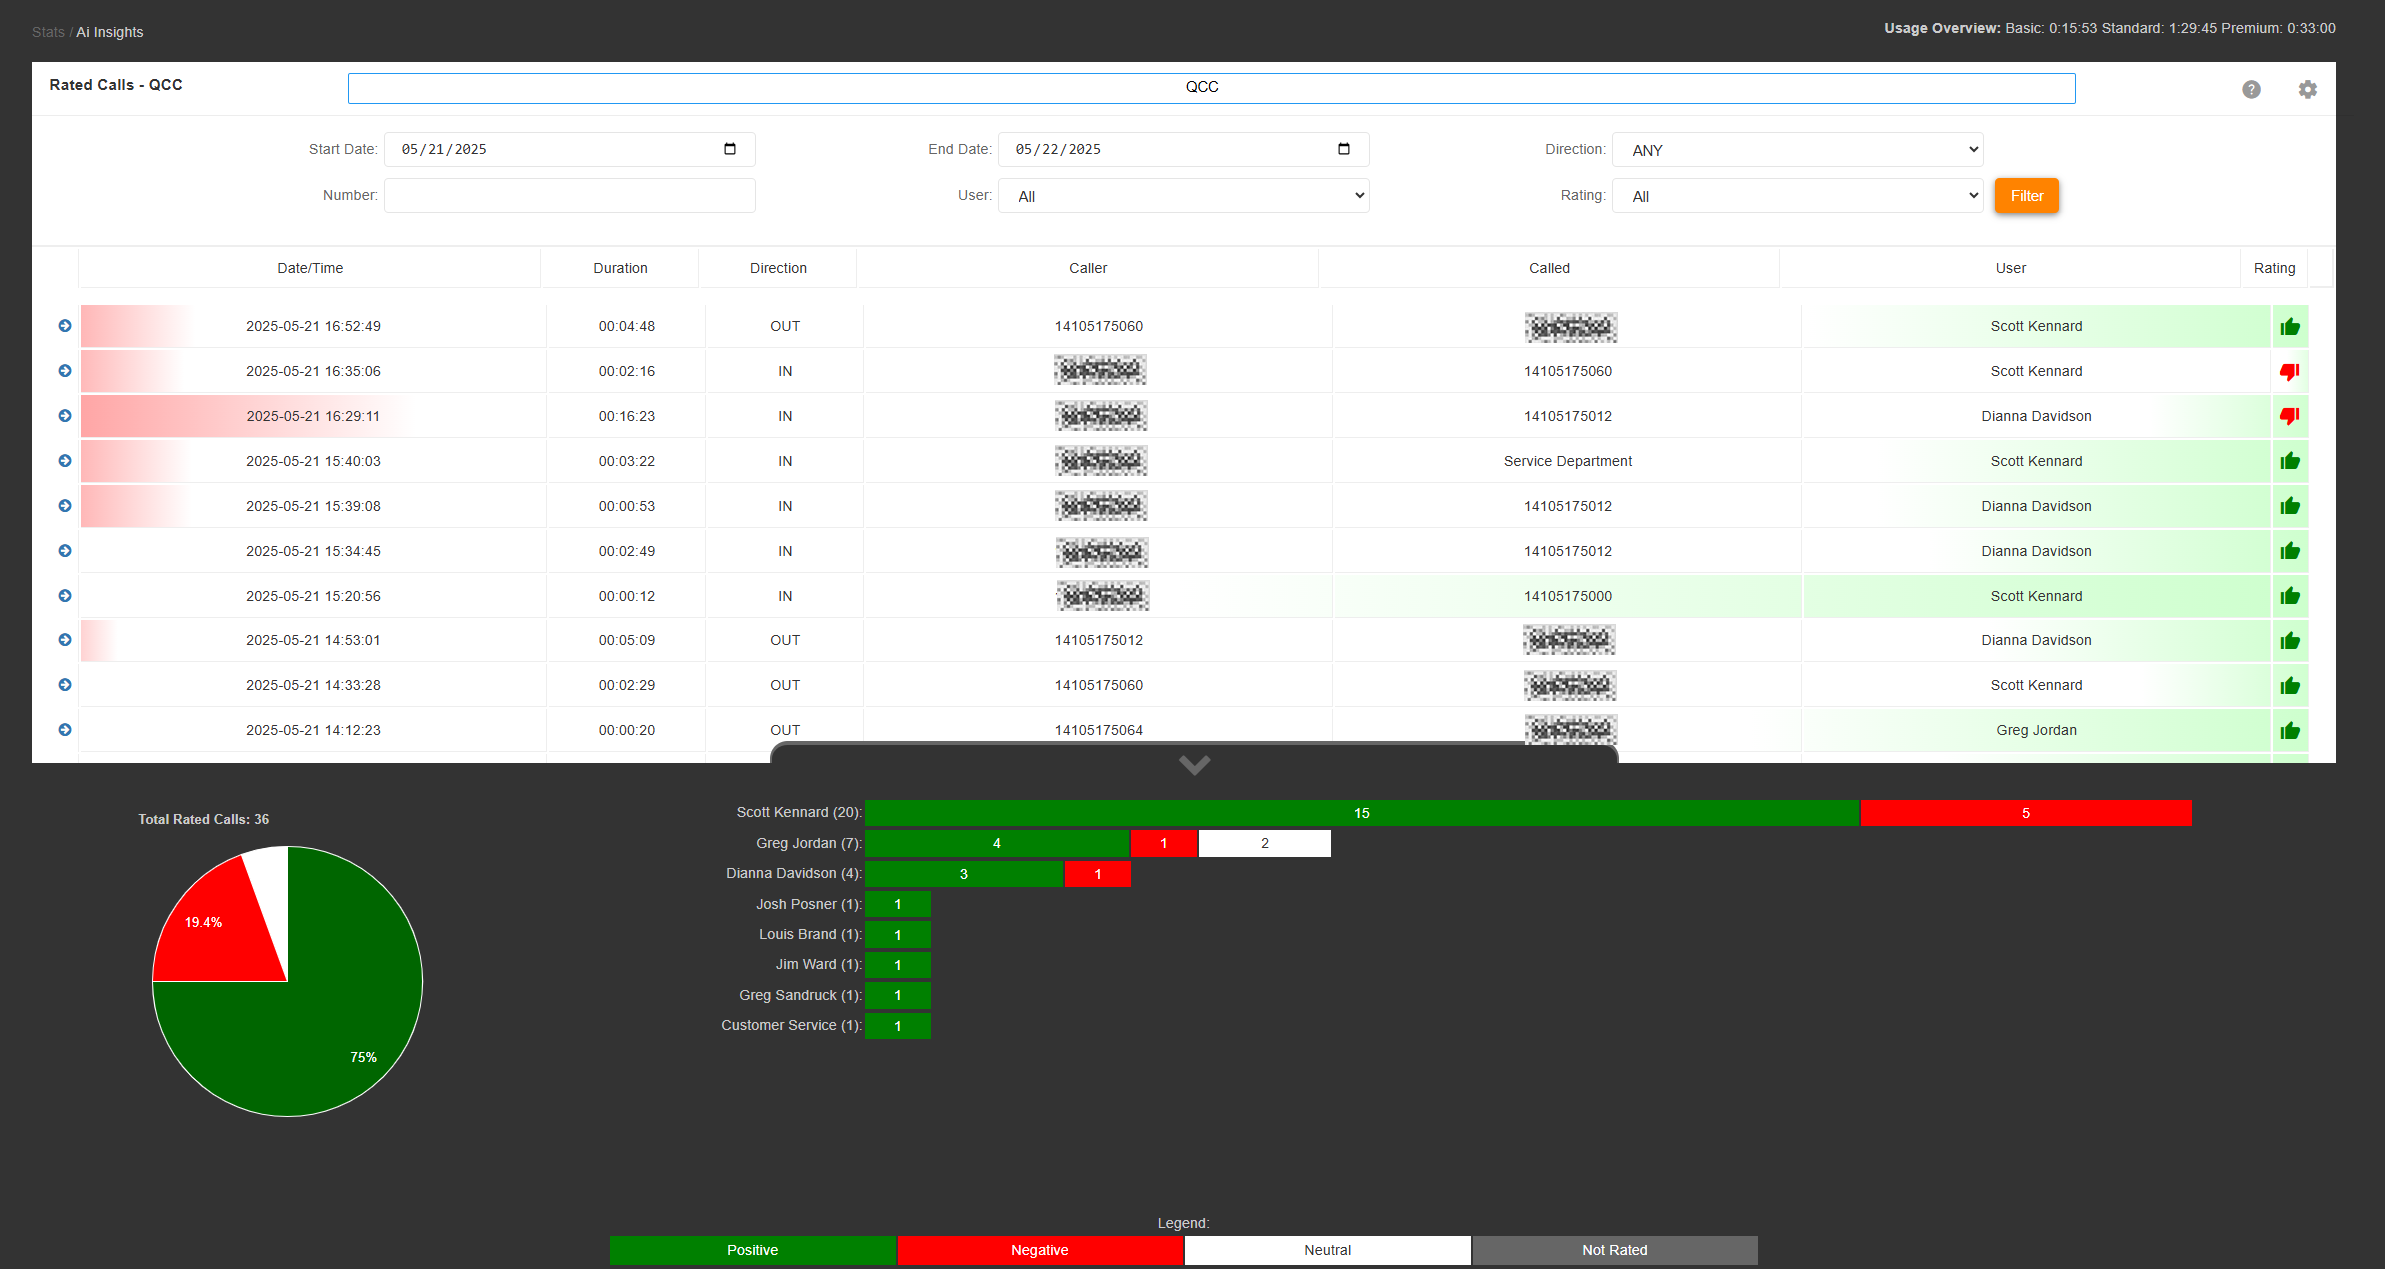
The value is displayed as a simple to understand thumb_up positive, thumb_down negative, or sentiment_neutral neutral sentiment icon on the right-hand side of each call.
More insight is also provided in the background shading of each call row. A percentage is calculated based on all of the sentiments detected. Greener is more positive, redder is more negative, and whiter is more neutral.
| 2025-05-22 08:45:55 | 00:00:22 | IN | 15551234567 | 18555175005 | John Doe |
Filtering Calls
The top of the page includes a manual filter form. Completing this form and selecting filter will display all calls that meet the set criteria.

- Start Date: Show calls since this date
- End Date: Show calls before this date
- Direction: Show calls that are either inbound, outbound, or both
- Number: Show calls to or from the specific phone number, or queue name in the event that queue rules are in use.
- User: Show calls to or from this specific system user. This is listed by name, and automatically populated based on insights filtered by the date filters.
- Rating: Show calls that are rated either positive, negative, neutral, or all calls.
Viewing a Call's Details
Each call row can be expanded by click in on the arrow icon to the left of the call row.
This will expand details of the call dependent on the insight tier chosen when configuring the service.
- Basic Tier
- If user login allows, an audio player will be displayed allowing you to playback a recording of the call.
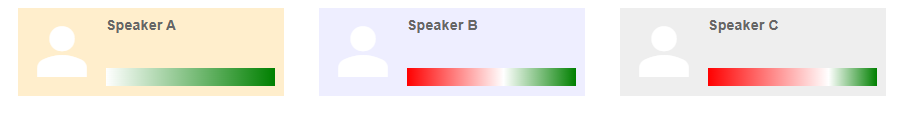
- Detected speakers will be listed individually with a unique background color and a rating bar depicting the positive to negative sentiment ratio.
- A transcript will be displayed in speech bubbles with backgrounds matching the detected speaker and positive and negative sentiments colored green or red respectively.
- Standard Tier
- All basic tier features.
- More accurate transcription.
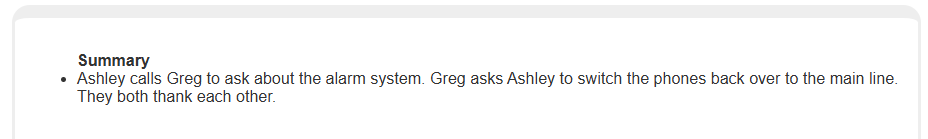
- A single bullet point summary of the call.
- Premium Tier
- All standard tier features
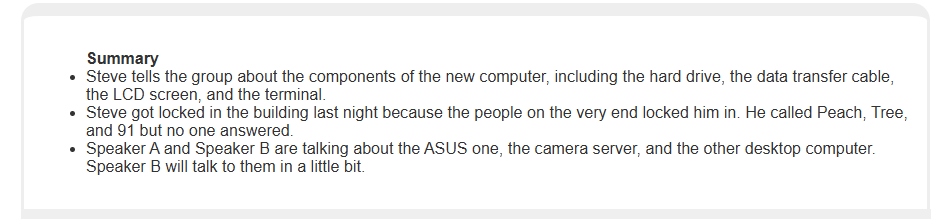
- An expanded multi point bulleted summary of the call.
- Personally Identifiable Information is detected and redacted from the transcript and the summary.
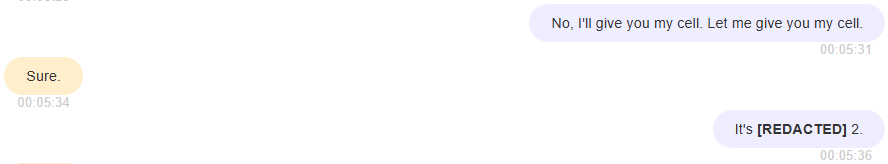
Downloading the transcript
All tiers include the ability to download a text file of each call's transcript. This can be accomplished by clicking the download download icon in the upper right-hand corner of each transcript.
Viewing an Overview of General Statistics
On the bottom of the page there is a slider tab with an up arrow that when selected will expand an overview of all filtered calls.
This overview provides a visualization and details of general information broken down into relevant categoriies displayed as pie charts and bar graphs.
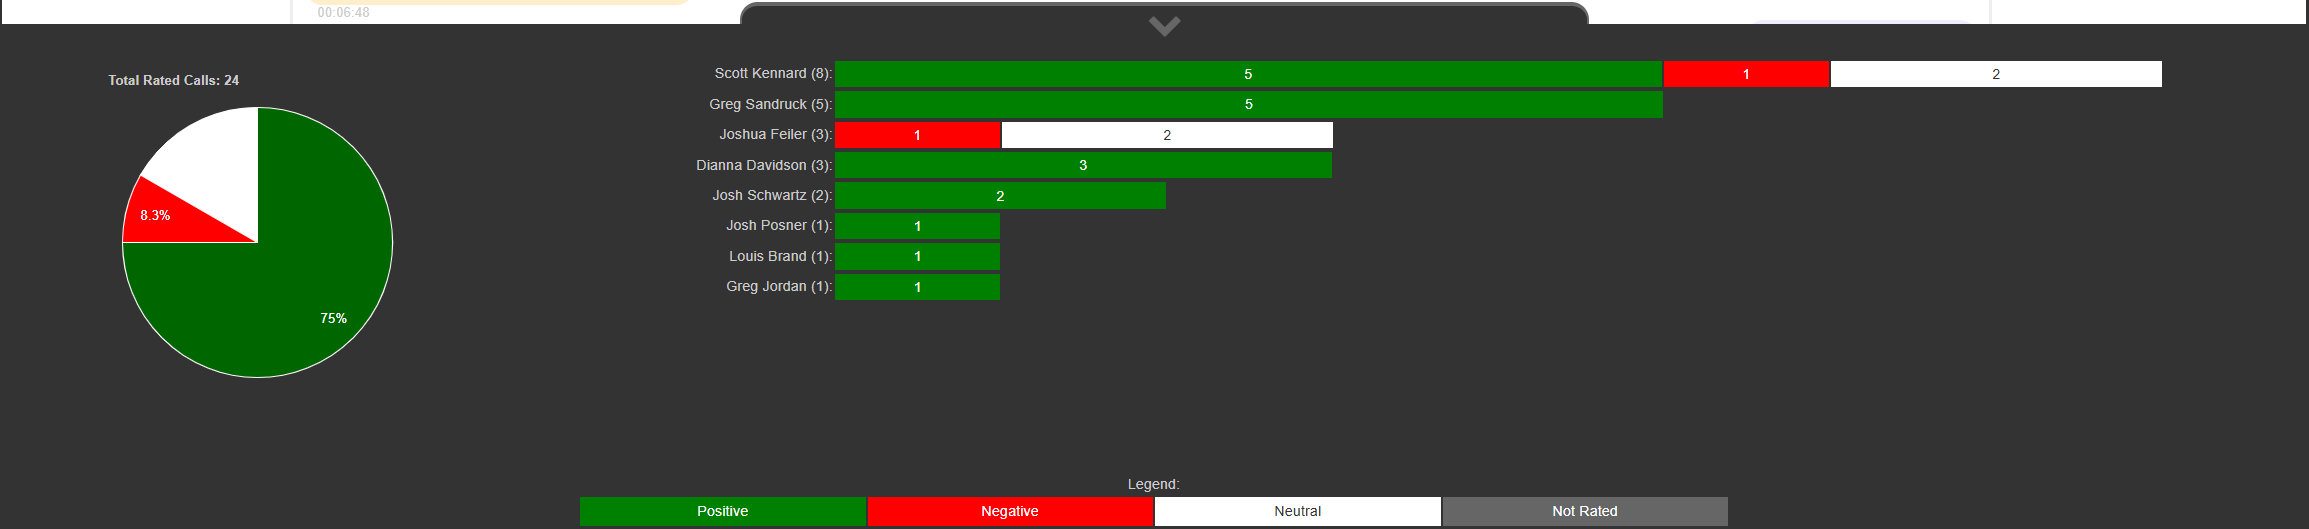
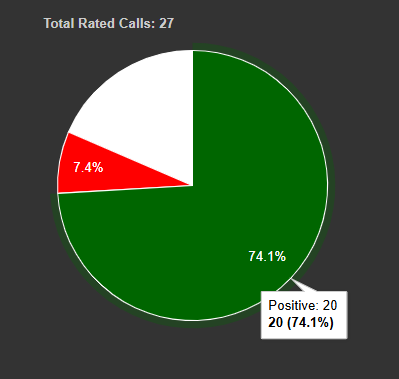
The pie chart shows the distribution of rated calls with each classification (positive, negative, and neutral) as a percentage of all rated calls. Mousing over a slice of the pie will reveal additional details. Clicking on any slice will change the filter for the calls shown. For example, to view all of the negative calls, click the red negative pie slice.
The stacked bar chart is a per user visualization of all of the filtered calls.
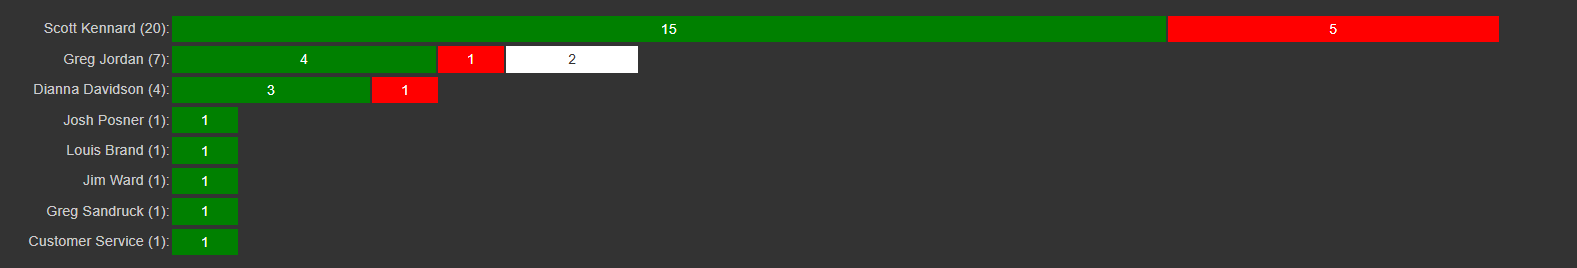
To see the specific details for a user, mouseover the users name.
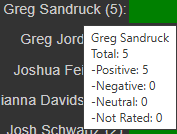
Clicking on the user's name will filter all calls by that user.
Clicking on the user's positive bar will filter all positive calls by that user. This applies to all bars for all users.